Highcharts 的 xAxis 中不定义 categories , 页面会报错?报错
$(function () {
$('#fuck').highcharts({
chart: {
type: 'spline'
},
title: {
text: '两地月平均温度'
},
subtitle: {
text: '数据来源: WorldClimate.com'
},
xAxis: {
type: 'linear'
},
yAxis: {
title: {
text: '温度'
},
labels: {
formatter: function () {
return this.value + '°';
}
}
},
tooltip: {
crosshairs: true,
shared: true
},
plotOptions: {
spline: {
marker: {
radius: 4,
lineColor: '#666666',
lineWidth: 1
}
}
},
series: [{
name: '东京',
data: [[5, 2], [6, 3], [8, 2]]
},{
name: '南京',
data: [[3, 2], [4, 7], [8, 5]]
}]
});
});
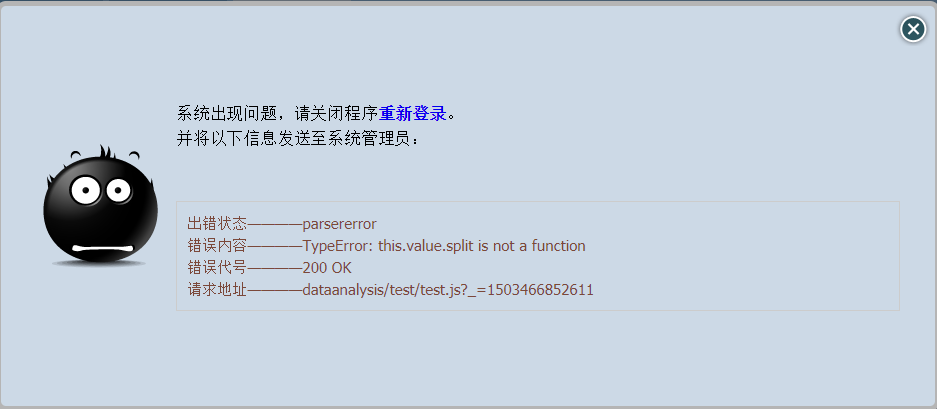
一样的代码,我新建一个程序就可以跑出来,但是在我原项目中,就会报错。
-
 https://developer.aliyun.com/profile/5yerqm5bn5yqg?spm=a2c6h.12873639.0.0.6eae304abcjaIB
报错有没有显示,是#多少的错误呢
这个平台上回答Highcharts问题较少,建议直接在Highcharts中文官网论坛上提问哦
1、Highcharts中文官网:https://www.hcharts.cn/
2、Highcharts中文学习教程:https://www.hcharts.cn/docs
3、Highcharts中文论坛:https://bbs.hcharts.cn/forum.php
2020-06-08 11:30:23赞同 展开评论 打赏
版权声明:本文内容由阿里云实名注册用户自发贡献,版权归原作者所有,阿里云开发者社区不拥有其著作权,亦不承担相应法律责任。具体规则请查看《阿里云开发者社区用户服务协议》和《阿里云开发者社区知识产权保护指引》。如果您发现本社区中有涉嫌抄袭的内容,填写侵权投诉表单进行举报,一经查实,本社区将立刻删除涉嫌侵权内容。